
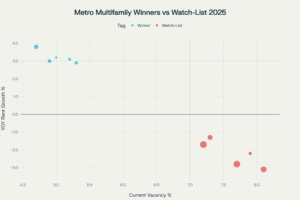
The national picture for multifamily in 2025 is defined by two opposing forces: the tail end of a historically large supply bulge and resilient, if uneven, renter demand. National rent growth is expected to be positive but below long‑term averages, while vacancy hovers above pre‑pandemic norms before gradually easing as deliveries decelerate into 2026.
For investors, that means performance is hyper‑local and materially path‑dependent: metros with balanced pipelines and structural barriers to entry are regaining pricing power, while high‑delivery corridors are still competing on concessions to defend occupancy.
Key Takeaways
-
Supply balance beats sizzle: Midwest and many coastal gateway/gateway‑adjacent markets are outperforming in 2025 because new deliveries are manageable versus steady demand, enabling positive effective rent growth with fewer concessions and quicker NOI stabilization.
-
Sun Belt caution—for now: Several high‑growth Sun Belt metros remain in a late‑cycle lease‑up phase with elevated concessions and negative or near‑zero effective rent trends in select submarkets; patience and hyper‑local selection are critical until the delivery wave burns off.
-
Outcome for investors: A barbell allocation—durable cash‑flow in Midwest/coastal now, plus staged Sun Belt re‑entry as pipelines taper—improves downside protection without sacrificing medium‑term growth.
-
Underwriting edge: Underwrite to effective rent, longer lease‑up timelines in oversupplied nodes, realistic refi cases, and reserve buffers; prioritize basis under replacement and supply‑lite locations to compress risk.
-
What to watch next: Concession depth/duration, absorption vs. deliveries by submarket, permits/starts rollover, renewal spreads/retention, and the income mix of job growth—these signals will clarify the pivot from “watch‑list” to “re‑enter” timing in Sun Belt nodes.
What’s driving the divergence is simple supply‑demand math. Markets that never overbuilt—or couldn’t, due to barriers—are normalizing faster. Markets that saw heavy 2023–2025 deliveries are still working through lease‑ups, which delays effective rent recovery and pushes true stabilization further out. This is why 2025 is less about chasing headline migration and more about validating a micro‑supply thesis submarket by submarket.
Why the Midwest leads
Supply discipline
- The Midwest benefits from smaller, more measured pipelines and fewer simultaneous lease‑ups. Even in growth corridors, deliveries generally line up better with absorption, creating less need for deep concessions. This keeps effective rents more stable and supports renewal‑led growth. Investors see the impact in higher lease retention and steadier occupancy, especially in Class B/B+ product where affordability advantages are most pronounced.
Affordability tailwinds
- Lower rent‑to‑income ratios reduce resident price sensitivity and support steadier renewal spreads. Crucially, Midwest renters face fewer “step‑up” alternatives into brand‑new Class A at heavy discounts because those lease‑up options are less pervasive than in overbuilt Sun Belt nodes. For operators, that aids in holding the line on concessions and reducing economic loss from turnover.
Pipeline trajectory
- Starts have rolled over, and completions are tapering. This matters twice: it supports pricing power today and sets up favorable 2026 comps as the supply cloud clears nationally. The Midwest entered this period with comparatively modest pipelines, so the region benefits first from a tighter rent‑setting environment and less NOI volatility.
Where this shows up
-
Chicago infill workforce and core‑adjacent Class B/B+ communities with strong school districts and commuting access.
-
Columbus and Cincinnati suburban nodes with constrained land, limited multifamily competition, and strong logistics/healthcare job anchors.
-
Indianapolis and Kansas City submarkets with balanced new supply, solid household formation, and below‑replacement acquisition basis opportunities.
-
Pittsburgh’s well‑located 1980s–2000s stock with modest CapEx plans that lift rent resilience without overcapitalizing.
Why coastal gateways rebound
Barriers to entry amplify pricing power
- High entitlement friction, stringent zoning, and replacement‑cost economics make coastal markets structurally supply‑constrained. When demand normalizes—even at a slower post‑pandemic rhythm—more of that demand converts to price rather than colliding with a flood of new units. This supports steadier rent growth at normalized occupancy, with fewer, shorter concessions.
Demand normalization and durable employment bases
- Gateway and gateway‑adjacent markets house diversified, high‑income employment bases across tech, healthcare, finance, and professional services, which buttress renter demand through cycles. Even with hybrid work, urban amenities and transit‑oriented locations have reasserted their pull, narrowing the pandemic‑era gap.
Right‑sized pipelines
- Deliveries exist, but they’re typically smaller and more dispersed—and often absorbed faster—than in Sun Belt peers. That reduces competitive lease‑up stress and preserves revenue‑management strategies, helping operators maintain asking/renewal spreads with limited giveaways.
Where this shows up
-
Boston core and lab‑adjacent neighborhoods; high barriers and life‑sciences spillovers.
-
Northern New Jersey, Newark/Jersey City, and Long Island: gateway‑adjacent pricing power with suburban convenience and constrained supply.
-
Washington, DC core‑plus: government and professional services anchors supporting stable absorption.
-
Orange County and the Inland Empire: replacement cost dynamics and logistics‑driven incomes underpinning steady rent growth.
-
Seattle and select Bay Area submarkets: tech‑weighted income resilience and stringent entitlements.
Sun Belt watch‑list: where to be cautious, and why
Oversupply and concessions
- The pandemic‑era construction boom disproportionately centered on fast‑growing Sun Belt metros. As projects delivered in 2024–2025, lease‑up competition intensified, pushing operators to prioritize occupancy via concessions, free rent, and aggressive look‑and‑lease incentives. Effective rent growth, not asking rent, tells the true story here—and in many corridors it’s still soft or negative.
Negative/flat rent prints in competitive corridors
- When multiple assets deliver within the same 3–5 mile radius, competing for the same renter profile, pricing pressure persists even with healthy demand. This is especially visible along suburban corridors where land availability encouraged simultaneous projects. The result: elongated lease‑up timelines and thinner day‑one yields.
Build‑to‑rent (BTR) overlap
- In several Sun Belt metros, new BTR communities add to the renter‑by‑choice competitive set, especially for households that value space and parking over Class A amenities. This narrows the spread a garden multifamily operator can sustainably push without losing prospects to BTR concessions.
Submarkets to avoid (for now)
-
Austin: Persistent concession depth across multiple corridors, a large 2024–2025 lease‑up cohort, and elongated stabilization. For acquisitions, demand visible evidence of concession compression and consistent positive net absorption before underwriting rent growth.
-
Phoenix: Elevated deliveries and BTR overlap. Monitor month‑over‑month burn‑off in concessions and the ratio of absorption to deliveries; emphasize infill or physically constrained nodes if pursuing new entries.
-
Dallas–Fort Worth: Among the nation’s delivery leaders, with pricing pressure across several suburban corridors. Underwrite longer lease‑up timelines, thicker OpEx/marketing, and lower initial effective rents.
-
Las Vegas: Soft to negative rent momentum in select nodes; watch for two or more consecutive quarters of effective rent recovery and reduced rent‑free periods before taking lease‑up exposure.
-
Atlanta and Charlotte: High near‑term supply relative to demand in growth suburbs; require submarket‑by‑submarket evidence of absorption outpacing deliveries, plus a visible decline in rent‑free weeks.
Important nuance
- Not all Sun Belt is off‑limits. In each flagged metro, there are resilient micro‑pockets: mature, supply‑constrained infill; vintage B/B‑ workforce with limited new competition; and neighborhoods with physical barriers or regulatory friction. Treat these as exceptions that prove the rule, and demand data that validates the moat.
What to buy—and where in 2025–2026
Midwest “slow‑and‑steady” income
-
Target stabilized or light‑value‑add assets where the pipeline is already balanced and concessions are minimal.
-
Prioritize below‑replacement acquisition bases and practical CapEx that elevates rent resilience (kitchen/bath refreshes, in‑unit laundry, energy‑efficiency) without chasing luxury comps.
-
Seek submarkets with strong school districts, short commutes, and diversified employment hubs; these factors support retention and reduce economic vacancy.
Coastal gateway/gateway‑adjacent resilience
-
Focus on Class B/B+ core‑plus with chronic underbuilding, tight replacement costs, and strong income anchors.
-
Emphasize transit‑serviced locations and institutional tenant demand; renewal‑led growth should be achievable without heavy concession use.
-
Underwrite modest, steady rent growth with low volatility; exit caps can be closer to historical means relative to oversupplied metros.
Sun Belt—opportunistic, staged re‑entry
-
Track permits and starts trendlines monthly; time entries as the pipeline rollover becomes durable.
-
Look for evidence of concession compression and two to three quarters of effective rent growth before underwriting lease‑up premium.
-
Consider recapitalizations or broken deals with protective basis, strong sponsorship, and superior micro‑location moats.
Underwriting guidance: the effective‑rent discipline
Underwrite to reality, not wishes
-
Model effective rents, not asking rents. Build in the prevailing concession depth and anticipated burn‑off cadence by submarket and asset class.
-
Extend lease‑up timelines in oversupplied nodes. Red team stabilization assumptions and marketing costs; assume longer absorption when three or more new comps sit within a five‑mile radius.
-
Normalize renewal spreads. In balanced Midwest/coastal markets, renewal spreads may be steadier and less volatile; in oversupplied corridors, assume tighter spreads and higher turnover until concessions recede.
Operational resilience
-
Prioritize revenue‑management guardrails to avoid rate whipsaws in shoulder seasons.
-
Build OpEx flexibility for elevated make‑ready and marketing during lease‑up waves; stress test economic vacancy during peak delivery months.
-
Focus CapEx on rent resilience—unit refreshes, in‑unit amenities, and targeted community upgrades that defend pricing power against “A‑lite” competition without overshooting ROI.
Capital structure and reserves
-
Use realistic debt service assumptions and refi cases that don’t rely on cap‑rate compression; include interest‑rate stresses and liquidity buffers, especially in watch‑list metros.
-
Build 12–18 months of operating and interest reserves for lease‑up or transitional business plans in supply‑heavy nodes.
-
Consider laddered maturities across a portfolio barbell to reduce refinancing concentration risk.
Exit strategy
-
In oversupplied markets, model wider exit cap ranges and build optionality into hold periods.
-
In Midwest/coastal, exits may be closer to historical averages given better supply balance; still include sensitivity around policy risks, tax changes, and local regulation.
How Value Plus Capital executes
Market scoring and gating
VPC’s market scorecards apply weighted criteria across:
-
Pipeline intensity: deliveries vs. trailing absorption, concessions depth/duration, and expected starts rollover.
-
Affordability: rent‑to‑income burdens and renewal affordability elasticities by class segment.
-
Income mix: share of jobs in sectors that rent B/B+ product, and quality of wage growth, not just job counts.
-
Regulation risk: landlord rules, property tax volatility, and permitting friction.
-
Replacement‑cost spreads: basis under replacement and likelihood of new supply at current costs.
Submarket heatmaps and micro‑selection
-
Within approved metros, VPC screens for hard barriers (topography, lakes/rivers, rail), regulatory friction, and competitive inventory age to locate pricing moats.
-
Heatmaps flag concession clusters, lease‑up radii, and marketing intensity so assets are not boxed into price wars.
-
Site selection emphasizes school scores, commute times, and retail/healthcare access that reinforce resident stickiness.
Asset selection and business plans
-
2025 priority: stabilized or light value‑add in Midwest/coastal; surgical Sun Belt entries only with data‑verified concession compression and protective basis.
-
Business plans favor renewal‑led NOI growth, amenity optimization, and OpEx audits; unit scopes elevate resiliency without overcapitalizing in competitive nodes.
-
For lease‑ups: conservative ramp schedules, robust marketing budgets, and clear break‑glass tactics if concessions deepen.
Signals to monitor quarterly
-
Concession depth and duration: The best early indicator of competitive intensity; look for multi‑month compression.
-
Net absorption vs. deliveries: Submarket‑level tracking confirms whether supply is being digested on schedule.
-
Permit and starts trendlines: Falling starts today reduce 2026–2027 risk; a durable rollover is the Sun Belt green light.
-
Renewal spreads and retention: Proof of affordability and product‑market fit, especially in Class B/B+.
-
Income mix and wage growth: Track the share of jobs in renter‑heavy sectors and income growth that supports rent momentum.
Talking points for LP conversations
-
Positioning: 2025 is about controlling micro‑supply risk. Choosing markets that earn pricing power from balance, not buzz, is the most reliable route to near‑term cash flow and medium‑term appreciation.
-
Risk management: Effective‑rent underwriting, stabilized‑asset preference in balanced markets, and conservative debt/refi cases protect downside while keeping upside optionality.
-
Timing: Sun Belt is not “out”—it’s “later.” The pipeline rollover, concession compression, and sustained positive net absorption will be the signals to pivot from watch‑list to acquisition.
We, at Value Plus Capital runs a disciplined, data‑first playbook designed for the 2025 landscape: lean into balanced, barriered markets for durable cash flow today, and stage Sun Belt entries as the data confirms supply burn‑off.
To review the current “Winners and Watch‑List” scorecards, submarket heatmaps, and live underwriting assumptions for target metros, book a strategy session at with us.